Looking at data and acting on data are two totally different things.
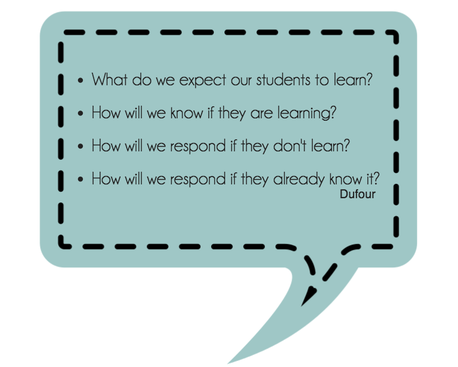
This year we have access to data that we haven’t had before and learning to use it in a way that is productive and that drives instruction has made many of us uncomfortable. It can be easy to look at formative and/or summative data and come up with reasons as to why the data is what it is, and that is the direction that most of our initial conversations went. Putting a stake in the ground and saying "this is just how our data looks" and then listing all of the reasons why it looks that way, doesn't align with Dufour’s four questions that drive a PLC’s work.
This year we have access to data that we haven’t had before and learning to use it in a way that is productive and that drives instruction has made many of us uncomfortable. It can be easy to look at formative and/or summative data and come up with reasons as to why the data is what it is, and that is the direction that most of our initial conversations went. Putting a stake in the ground and saying "this is just how our data looks" and then listing all of the reasons why it looks that way, doesn't align with Dufour’s four questions that drive a PLC’s work.
Data is a puzzle piece which helps tell a student's story. When used correctly, data allows a teacher to make changes, innovate their teaching practices, and collaborate with their PLC. By no means is data the sole piece, but with it, educators can work toward the common goal of student learning. Curriculum is built and adjusted by what we learn from data.
I have learned a few things about data driven instruction this year.
- Looking at summative data when students have left a classroom and moved on can be compared to looking at an autopsy of their learning. We can see what they did and didn't master but we have lost the chance to impact their learning. Educators can use the data as an overall scorecard for the curriculum, but it can't drive instruction for incoming students in a measurable way.
- If new universal assessments are brought on board to help measure growth, teachers need to be educated about the research behind them, their purpose and how the data will be used. (If this doesn't happen, teachers may see the assessment as a compliance piece and the assessment may not be administered with fidelity. Then in turn the validity of the data that is being looked at may be questioned.)
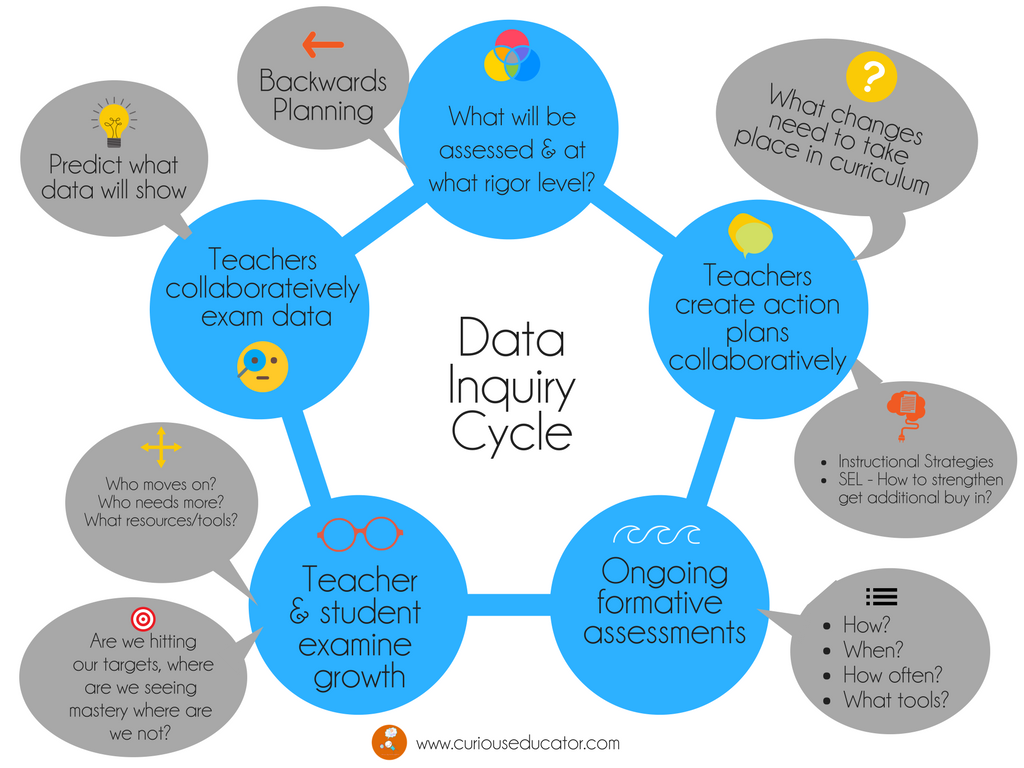
- When on-boarding new tools to disaggregate data, start small with something like a unit test. Beginning with backward planning is critical. Guide PLC's through the use of a Data Inquiry Cycle to analyze and act upon data. Encourage each PLC to be as concrete as possible.
- Too often the teacher is the only one that sees and tries to make meaning of data. The quicker and more personal the feedback is to students the better. Using data with students empowers them and allows them to take control of their learning. Students can use data to help them understand that learning is a process of growth over time. Educators who realize the full potential of data go beyond occasionally sharing test results with students. The systems and tools that a school uses should make it easy for students to view their own data.
It takes TIME even with great tools. As the time spent yields results and teachers see student's learning progressing, buy-in builds. Rich, interesting discussions emerge within PLC's. We have to honor this time and make sure that our teachers have it.
As with most new things, it has been hard and we will continue to learn from others and ask questions. I am grateful for strong campus leadership committed to continuous improvement guiding our work. I also appreciate the honesty and feedback that the PLC's working with data on our campus have offered about their experience. I am convinced that with time, good tools and applying best practices, rich data mixed with the art of teaching will continue to impact learning.
A book that has been helpful in my own learning this year is Driven by Data by Paul Bambrick-Santoyo. Thank you for the sharing this as a resource @Jennifer_Hogan and @DrJimmyShaw. And a shout out to @cwehde for all of her help and support this year.
If you have thoughts, resources or blog posts that can help in our journey, I would love for you to share them!


 RSS Feed

