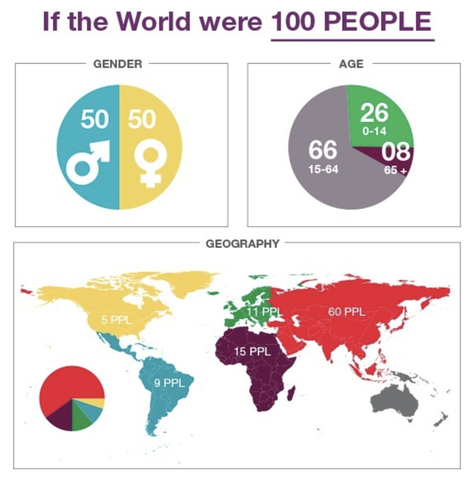
We see infographics all the time. They are visual images used to share information or data. Infographics work in the classroom because they grab students and allow an entry point to learning — and because they sum up pages and pages, even chapters, of information that would take a student hours to process. In addition to organizing information for students, infographics can be one more option when students are asked to research, share their findings, or analyze information. It is an alternative way for them to creatively communicate knowledge or an idea using a combination of visuals and small snippets of text.
If you haven't created an infographic yourself, here is a good blog post that walks you through the process. (Like just about everything these days, we have to teach ourselves before we can help our students learn!)
- This will save you tons of time - Here is a link to a lesson plan with resources all ready to go so that teachers can introduce what an infographic is and how it organizes and presents information.
- Fantastic Resource - Kathy Schrock has a Guide to Using Infographics as a Creative Assessment. She includes links to help develop formative or summative assessments that have students creating infographics to showcase their mastery of knowledge. Check it out, because there is A LOT there!
- One free tool that will help students create an infographic is Easel.ly. This site requires no sign in at all so you can either plan to have students create in one sitting OR you can use the "groups" feature to create users under your e-mail that require no shared personal information. This is a nice option that will then allow the students to collaborate. The groups feature also enables students to save and come back to their designs later.
Easel.ly also has a ton of templates already available as starters. For example, if a student or group plans to compare/contrast two things, there is a template available to either edit or to inspire them to create their own from scratch. While there is a pro version, the free version offers everything our students need to create their own infographics. - Use Google Slides or Microsoft Powerpoint to create infographics. There are templates that have been created to guide students. Read all about how you can use the tools you already have on your device to create infographics on this TCEA Blog Post Infographics Made Simple.
If you have additional resources or examples of using infographics in our learning environments please leave them below!







 RSS Feed
